Garage Reports
Reports in the sidebar is where garage admins and reporting-only users see how the garage is performing. The sidebar link is shown to those two roles only -- front-of-house don't get it, and their money view is the dashboard's Money tab. The page itself isn't locked, though: someone who types the address still lands on the shell, and most of the figures refuse to load for them.
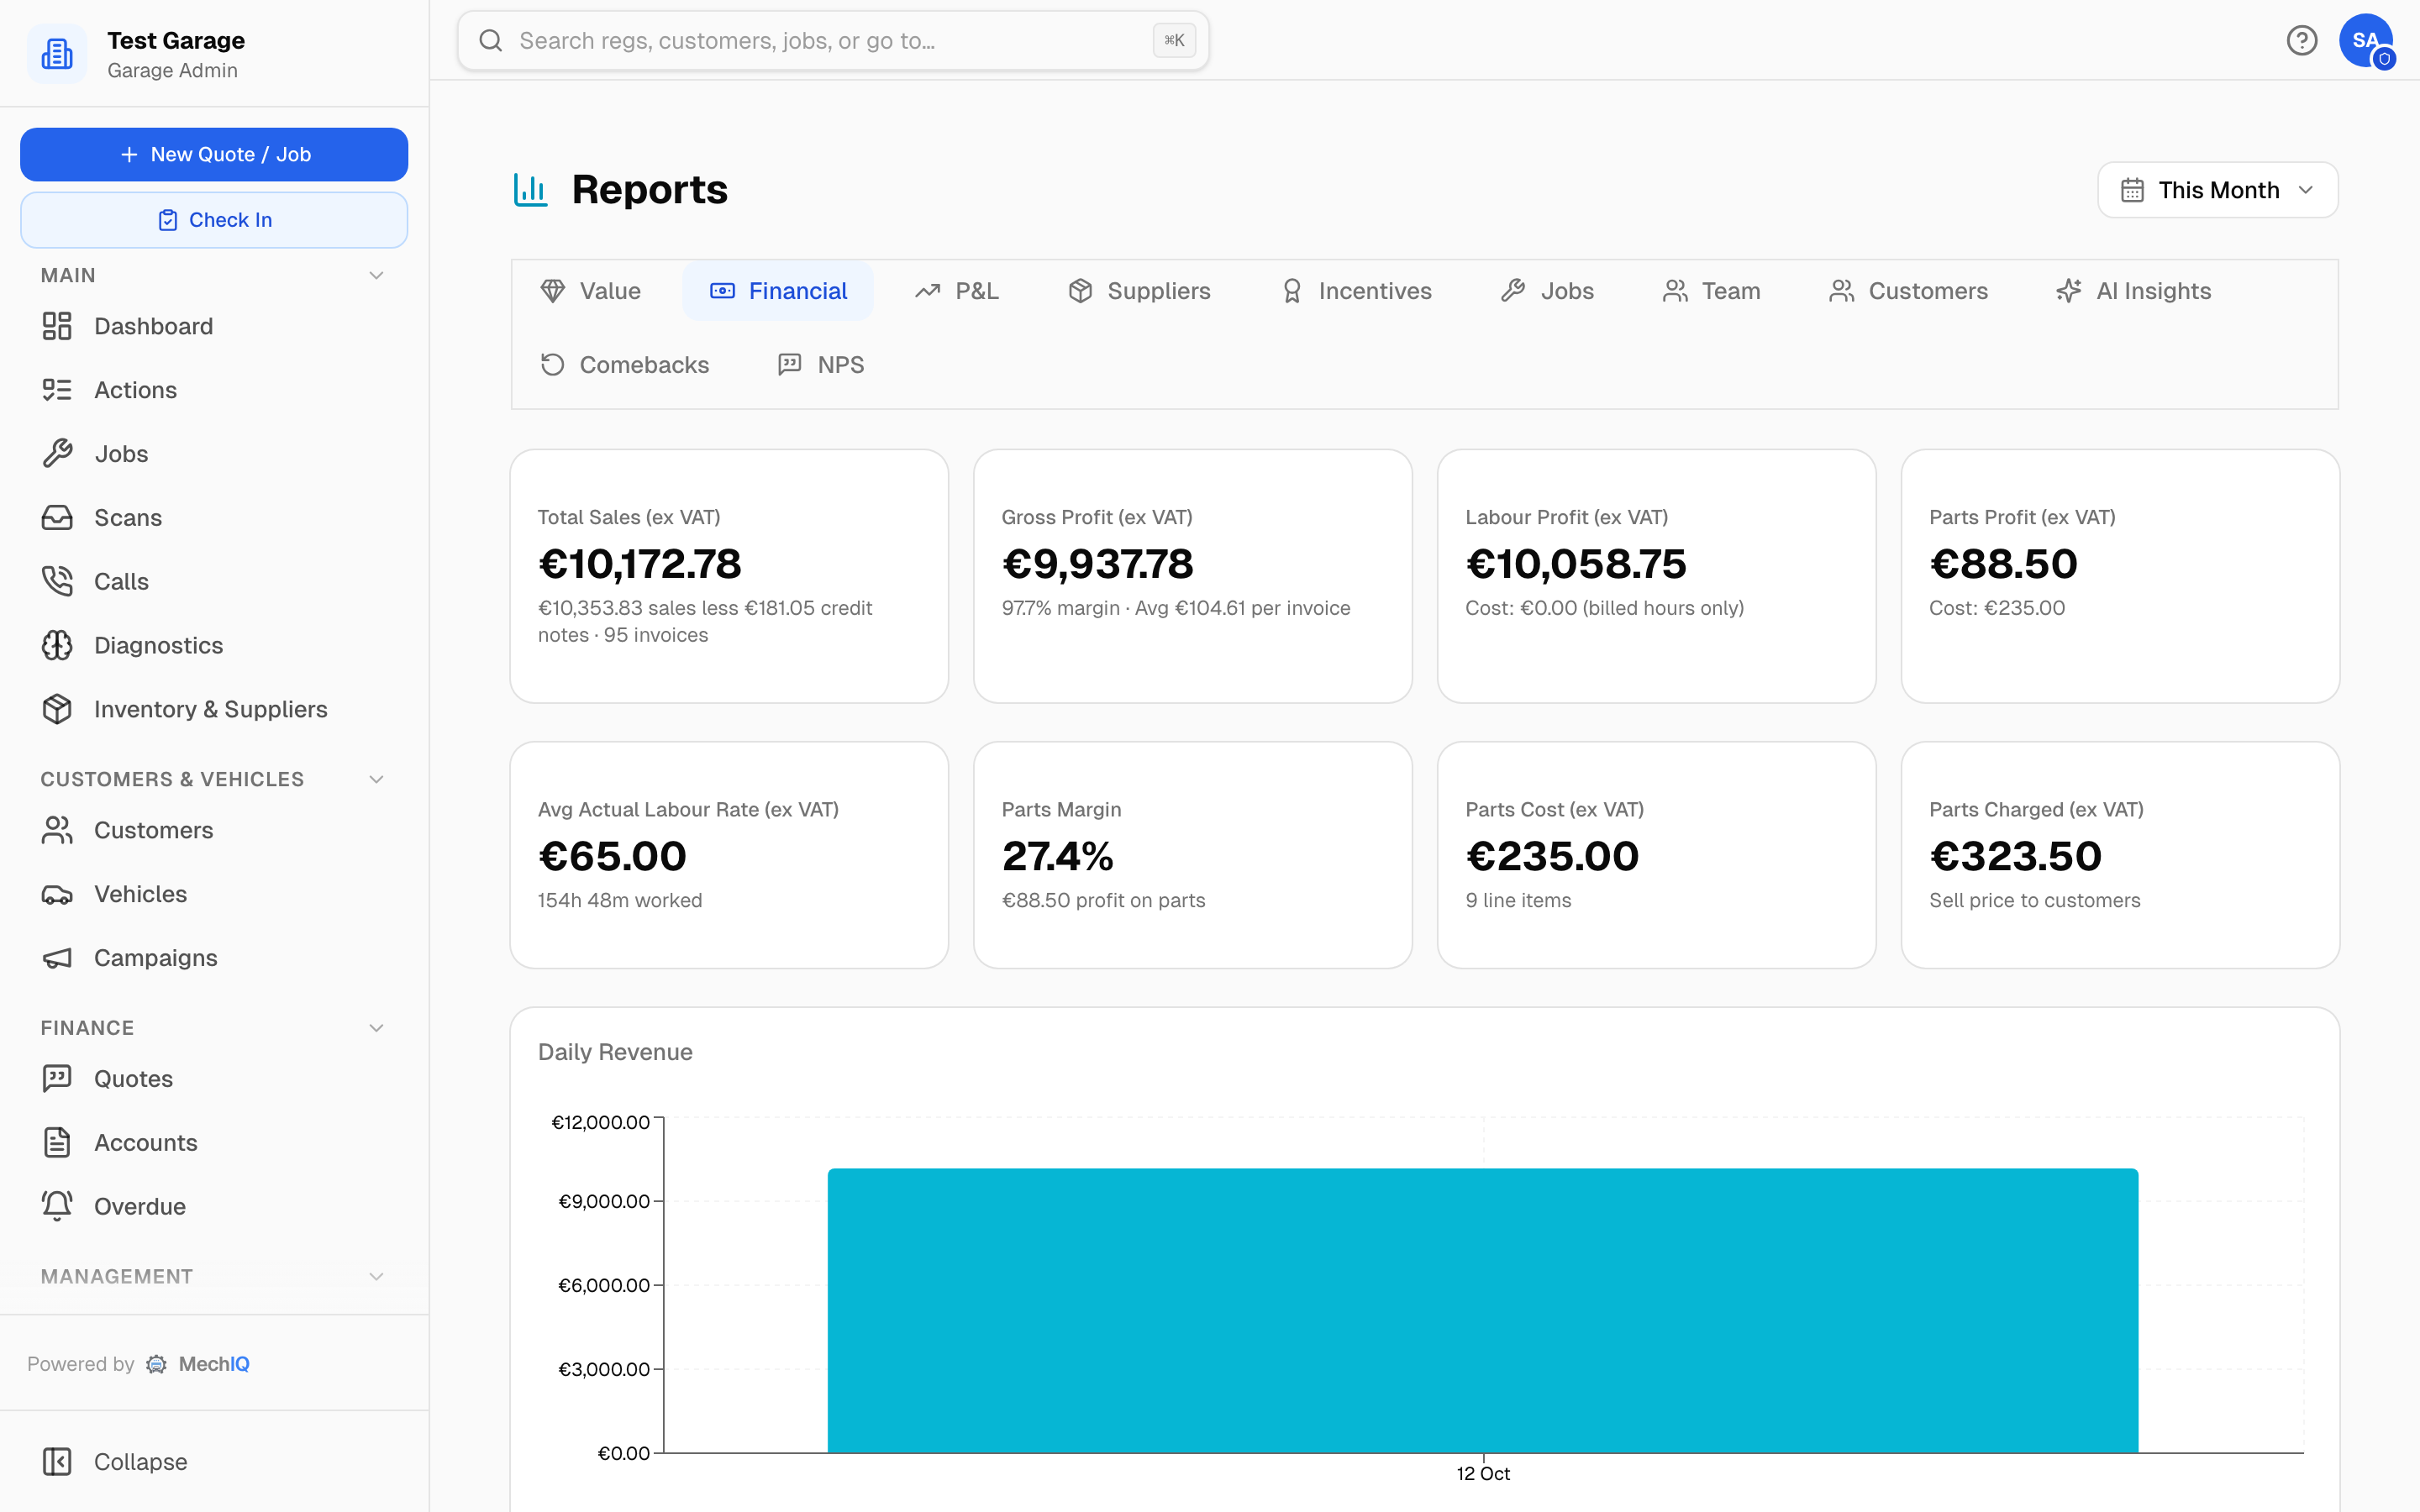 Reports → Financial. The period picker top-right applies to every tab that has a period.
Choosing a period
The picker at the top right (This Month by default) offers presets and a custom date range. Every figure on a tab is for that period; some tabs have their own window instead and ignore the picker -- P&L (6, 12 or 24 months), Value (this calendar month), Suppliers (this calendar month against last), NPS (90 days) and the Team tab's jobs-that-ran-long list (30 days).
Value
What MechIQ delivered — for the period and since you joined: quotes accepted (value and count), additional work approved through online approvals, quote conversion, AI actions run, and estimated front-desk and technician hours saved. The weekly summary PDF can be downloaded here -- every figure on it (revenue, quotes accepted, additional work approved and the value MechIQ helped land) is ex VAT; the same summary can be emailed every Monday from Customer Messaging.
Financial
- KPI cards — Total Sales (ex VAT) with invoice count (net of any credit notes dated in the period — the card says €X sales less €Y credit notes when there are some; the dashboard's figures for the same days are the same -- see Which money figure is which), Gross Profit with margin and average profit per invoice, Labour Profit, Parts Profit, Avg Actual Labour Rate with hours worked, Parts Margin, Parts Cost and Parts Charged.
- If the period's gross margin is below your target profit margin, an amber banner says by how much and links to Settings → Pricing.
- Daily Revenue chart, Revenue Split (labour vs parts), Parts Margin Breakdown (by part, supplier and category), Slow-moving stock (idle for 30–365 days, your choice), and a VAT Summary -- one row per VAT rate (net, VAT, gross) with the totals, on a stated basis. Invoice basis (the default) counts every invoice and credit note by the date it was raised -- the same documents as Sales on this tab. Cash basis counts the money by the date it was received. Your garage's basis is set in Settings -> Tax & VAT -> VAT report basis; the buttons on the card show the other basis without changing the setting.
Gross profit is sales ex VAT minus parts cost, minus technician wage cost only when Cost my labour (show net margin) is on under Pricing -- so with that off it is parts profit plus labour sales. Written-off invoices (all charges written off at checkout) are excluded from sales.
Parts margin is one figure. Parts Profit = the parts sold (with a known cost) less the credit notes on parts, less what those parts cost. Parts Margin = that profit as a share of the same sales. The dashboard's Parts profit tile and its margin are the same figures for the same days. Parts that a fixed price included are a cost of the fixed price (labour), so they come off Gross Profit but not off the parts margin.
Which parts are in the period. Every parts figure on this tab -- Parts Profit, Parts Margin, Parts Cost, Parts Charged and the breakdown -- covers the same parts: the parts on the bill of the jobs invoiced in the period. Parts that were declined, returned to the supplier, or are on a job not invoiced yet are left out. A part's cost is what you actually paid when the delivery was booked in, otherwise the estimate.
Parts from your old system. Invoices brought in from your previous system (for example Garage Hive) count in Total Sales, but your old system's export had the selling price only, not what you paid. So those parts are left out of Parts Cost, Parts Profit and Parts Margin, and the cards say how much was left out (excl. €X old-system parts (no cost recorded)). In Gross Profit they count at no margin, so profit is never overstated. On every tab, imported jobs, labour and customers never count as new work in the month you imported them -- your old history shows through its invoices, dated when they were really raised.
P&L
The owner's month-by-month view over 6, 12 or 24 months: revenue, parts cost, labour cost, gross profit and margin, with a chart and a table. Revenue is invoiced sales ex VAT; costs are recorded parts cost (parts from your old system at their selling price, so they add no margin) plus technician wage cost when labour costing is on — otherwise the tab says margin is gross of labour cost. Garage admins and reporting users only.
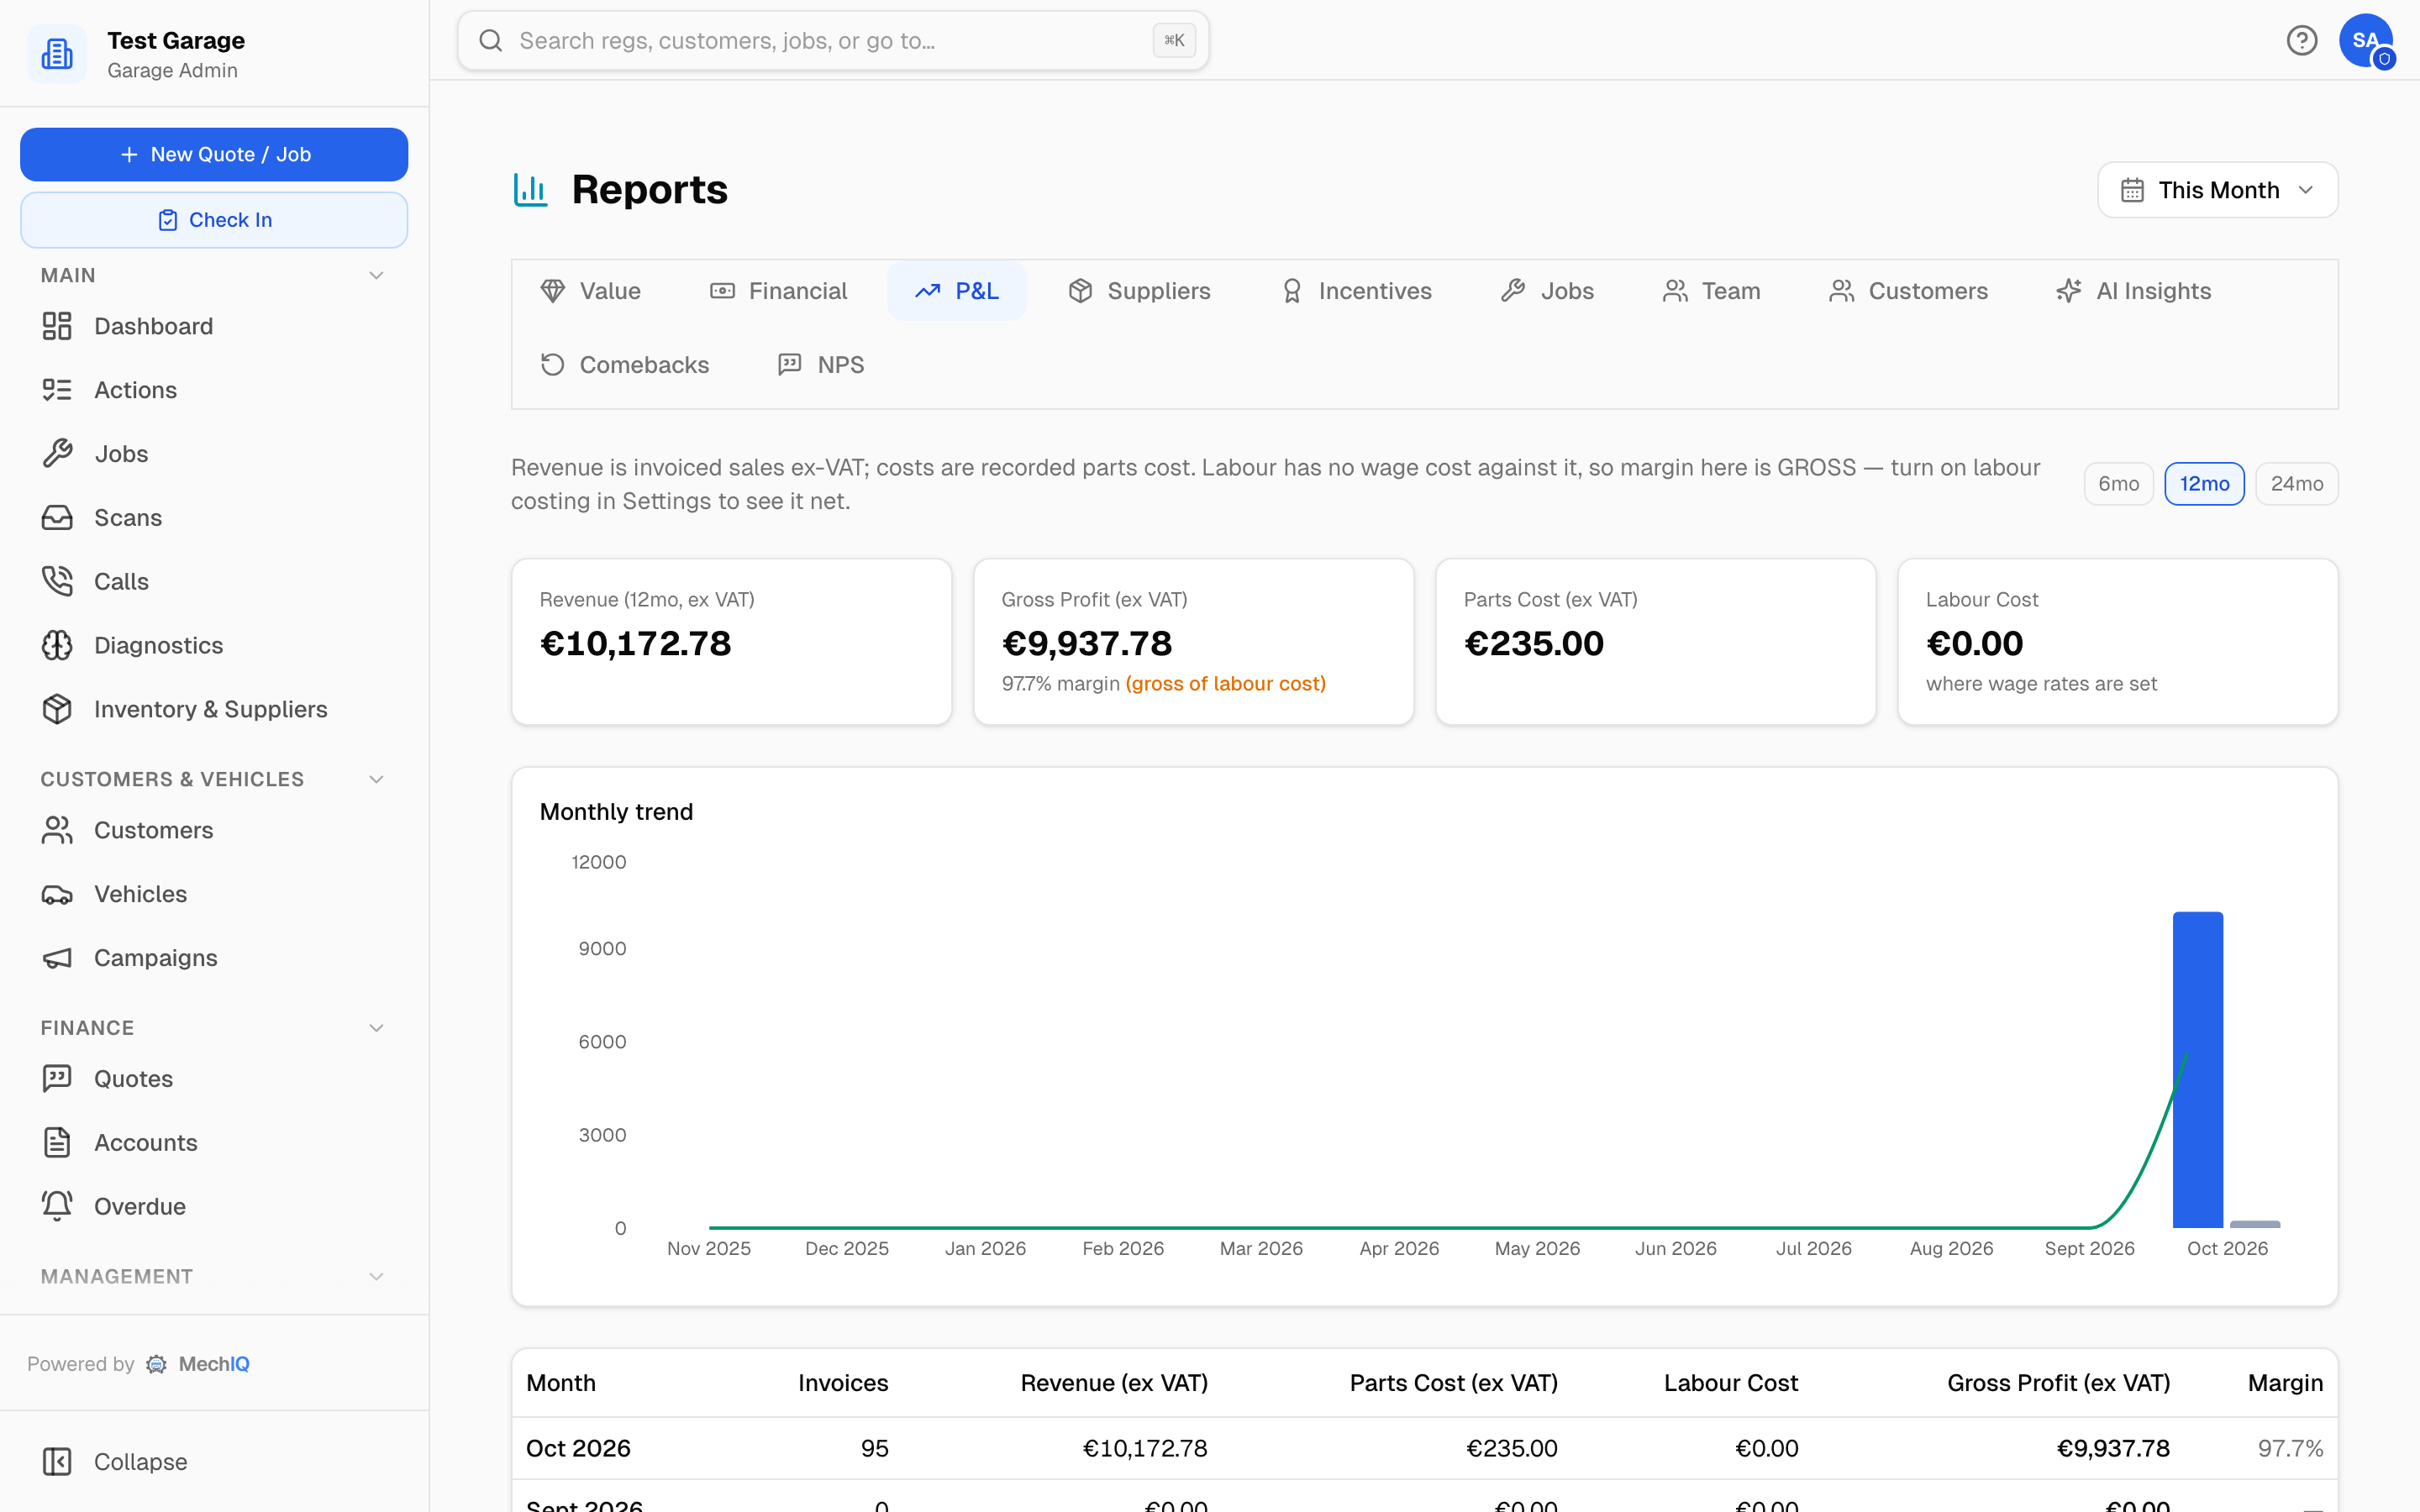 Reports → P&L.
Breakdown
The period's sales split four ways. Pick a view with the buttons at the top. Garage admins and reporting users only.
- By job type — for each job type: invoices, sales (ex VAT), labour sales, parts sales, parts cost, discounts, gross profit and GP % (gross profit as a share of sales), with a total row. Labour cost is shown too when Cost my labour is on under Pricing. Gross profit is the same figure as everywhere else: labour and parts sales, less parts cost (and labour cost when you cost it), less the discounts on the bill.
- By technician — the same columns per technician. A job counts under its technician: the one assigned, or else the last one who worked on it. Jobs with no technician are under No technician.
- By customer — invoices, sales and credit notes per customer, the customer each invoice is billed to. Account (trade) customers have an Account badge; tick Account customers only to see just them. There is no gross profit per customer, because a split warranty or insurance bill can't split its parts and labour between the two customers.
- By payment method — the payments received in the period, by the day the money came in: cash, card, bank transfer, cheque and so on, with refunds (money out) and the net. These are inc VAT and they are payments, not sales — an invoice put on account is a sale with no payment yet, and a deposit is a payment before any sale.
Sales are invoices raised in the period. A credit note dated in the period is shown in its own column, next to Net sales (sales less credit notes). It is not counted as an invoice, and it comes off gross profit, the margin and the average sale -- the same figures as the dashboard, the Financial tab and the P&L. Written-off invoices are not sales.
Suppliers
Parts spend by supplier — this month against last, and how many suppliers you actually bought from — so you can see where the money goes. Spend is the ordered value ex VAT of orders that have been placed (ordered, shipped, partly received, received); drafts and cancelled orders don't count, and credit notes come off as negatives. The two months are calendar months on your garage's clock, and the tab ignores the period picker. Garage admins and reporting users only.
Incentives
The results of the optional staff incentives scheme: a table per rule (FOH sales target, technician labour target) with each person's actual, target and Hit / Not yet for the period. If the scheme is off the tab says so. Garage admins and reporting users only.
Jobs
Jobs completed and created, average cycle time, quote conversion (X of Y quotes sent were accepted -- the same figure as the Value and AI Insights tabs) and outstanding quotes; then Jobs Completed Per Day, Booking Sources, Current Job Status, Top Job Types and the Quote Pipeline.
Average cycle time runs check-in to collection -- the clock stops when the customer takes the car away, not when the work is finished, so cars left sitting on the forecourt lengthen it.
Booking Sources splits bookings into Walk-in, Phone, Online Booking and Front of House. Open the Team tab once before it: on a fresh visit to Jobs the chart has no data loaded and reads No booking data.
Team
- Jobs that ran long and Overtime reports at the top.
- KPI cards: active technicians and hours sold, jobs completed (the same count as the Jobs tab), labour revenue, and the team's Efficiency.
- Efficiency is the trade measure, the same on every screen: hours sold ÷ hours clocked, on the jobs each technician clocked that were finished in the period (open jobs are still moving, so they do not count). Over 100% means the work took less time than it was sold for. A technician with under 1 hour clocked on finished jobs has no efficiency: the cell shows a dash, and hovering it says why. The team figure is the same sum over the rows, never an average of percentages.
- Technician Performance — per tech: jobs finished (the jobs finished in the period that they logged time on, so two technicians on one car both count it; a job is finished when it was marked complete, not when it was last changed), hours sold and hours clocked on those same jobs, efficiency (under it, the hours sold and clocked that make it) and labour revenue for the period. Profit and Margin show only when Cost my labour (show net margin) is on under Settings -> Pricing; with it off the note under the table says the figures are gross, and how to see profit: set each person's Cost / hour in Team → Staff, then turn on labour costing. Labour logged with no technician on it is not a row: a line under the table gives its hours and value so you can add the technician.
- Specialisation by Job Type — the fastest technician for each job type two or more techs have done, and the most profitable one when Cost my labour is on (without a wage cost, a technician's "profit" would only be what their labour was billed at, so none is named). The most profitable job type line under Technician Performance follows the same rule.
- Network Benchmarking — your average time per job type against the anonymised MechIQ network. A job type only gets a comparison once at least three garages have done it, and the figures are republished once a day; until then there is nothing to compare and the card isn't on the tab at all.
- Tech Workload (estimated vs actual hours) and Technician Utilisation (billable hours against scheduled hours).
Customers
- Outstanding Balances — lives on Customers -> Money owed (where the chasing and the statement run happen); for a garage admin this tab links there. Reporting-only users, who have no Customers page, see the same panel here. When nobody owes anything it says so. Otherwise: the total outstanding (inc VAT), the number of customers, an ageing bar (current / 30 / 60 / 90+ days) and a table per customer with the oldest invoice age; expand a row for the invoices. Account customers carry an Account badge.
- Send statements… — the statement run. A dialog lists every customer who owes money or has money held on account -- account or not -- who can be emailed, with their balance -- those who owe are ticked; anyone only in credit shows €X in credit and starts unticked; untick anyone you'd rather ring, then Send N statements. Customers who can't be emailed are listed separately with the reason -- no address, or an address that bounced before -- to follow up by phone, and afterwards you see exactly who was sent one and who wasn't. Download N PDFs saves the whole run as a zip instead, and that one does include the customers who can't be emailed, so you can post or hand those over.
- KPI cards: active, new, returning and first-time customers; then Customer Mix and Top Customers by Spend.
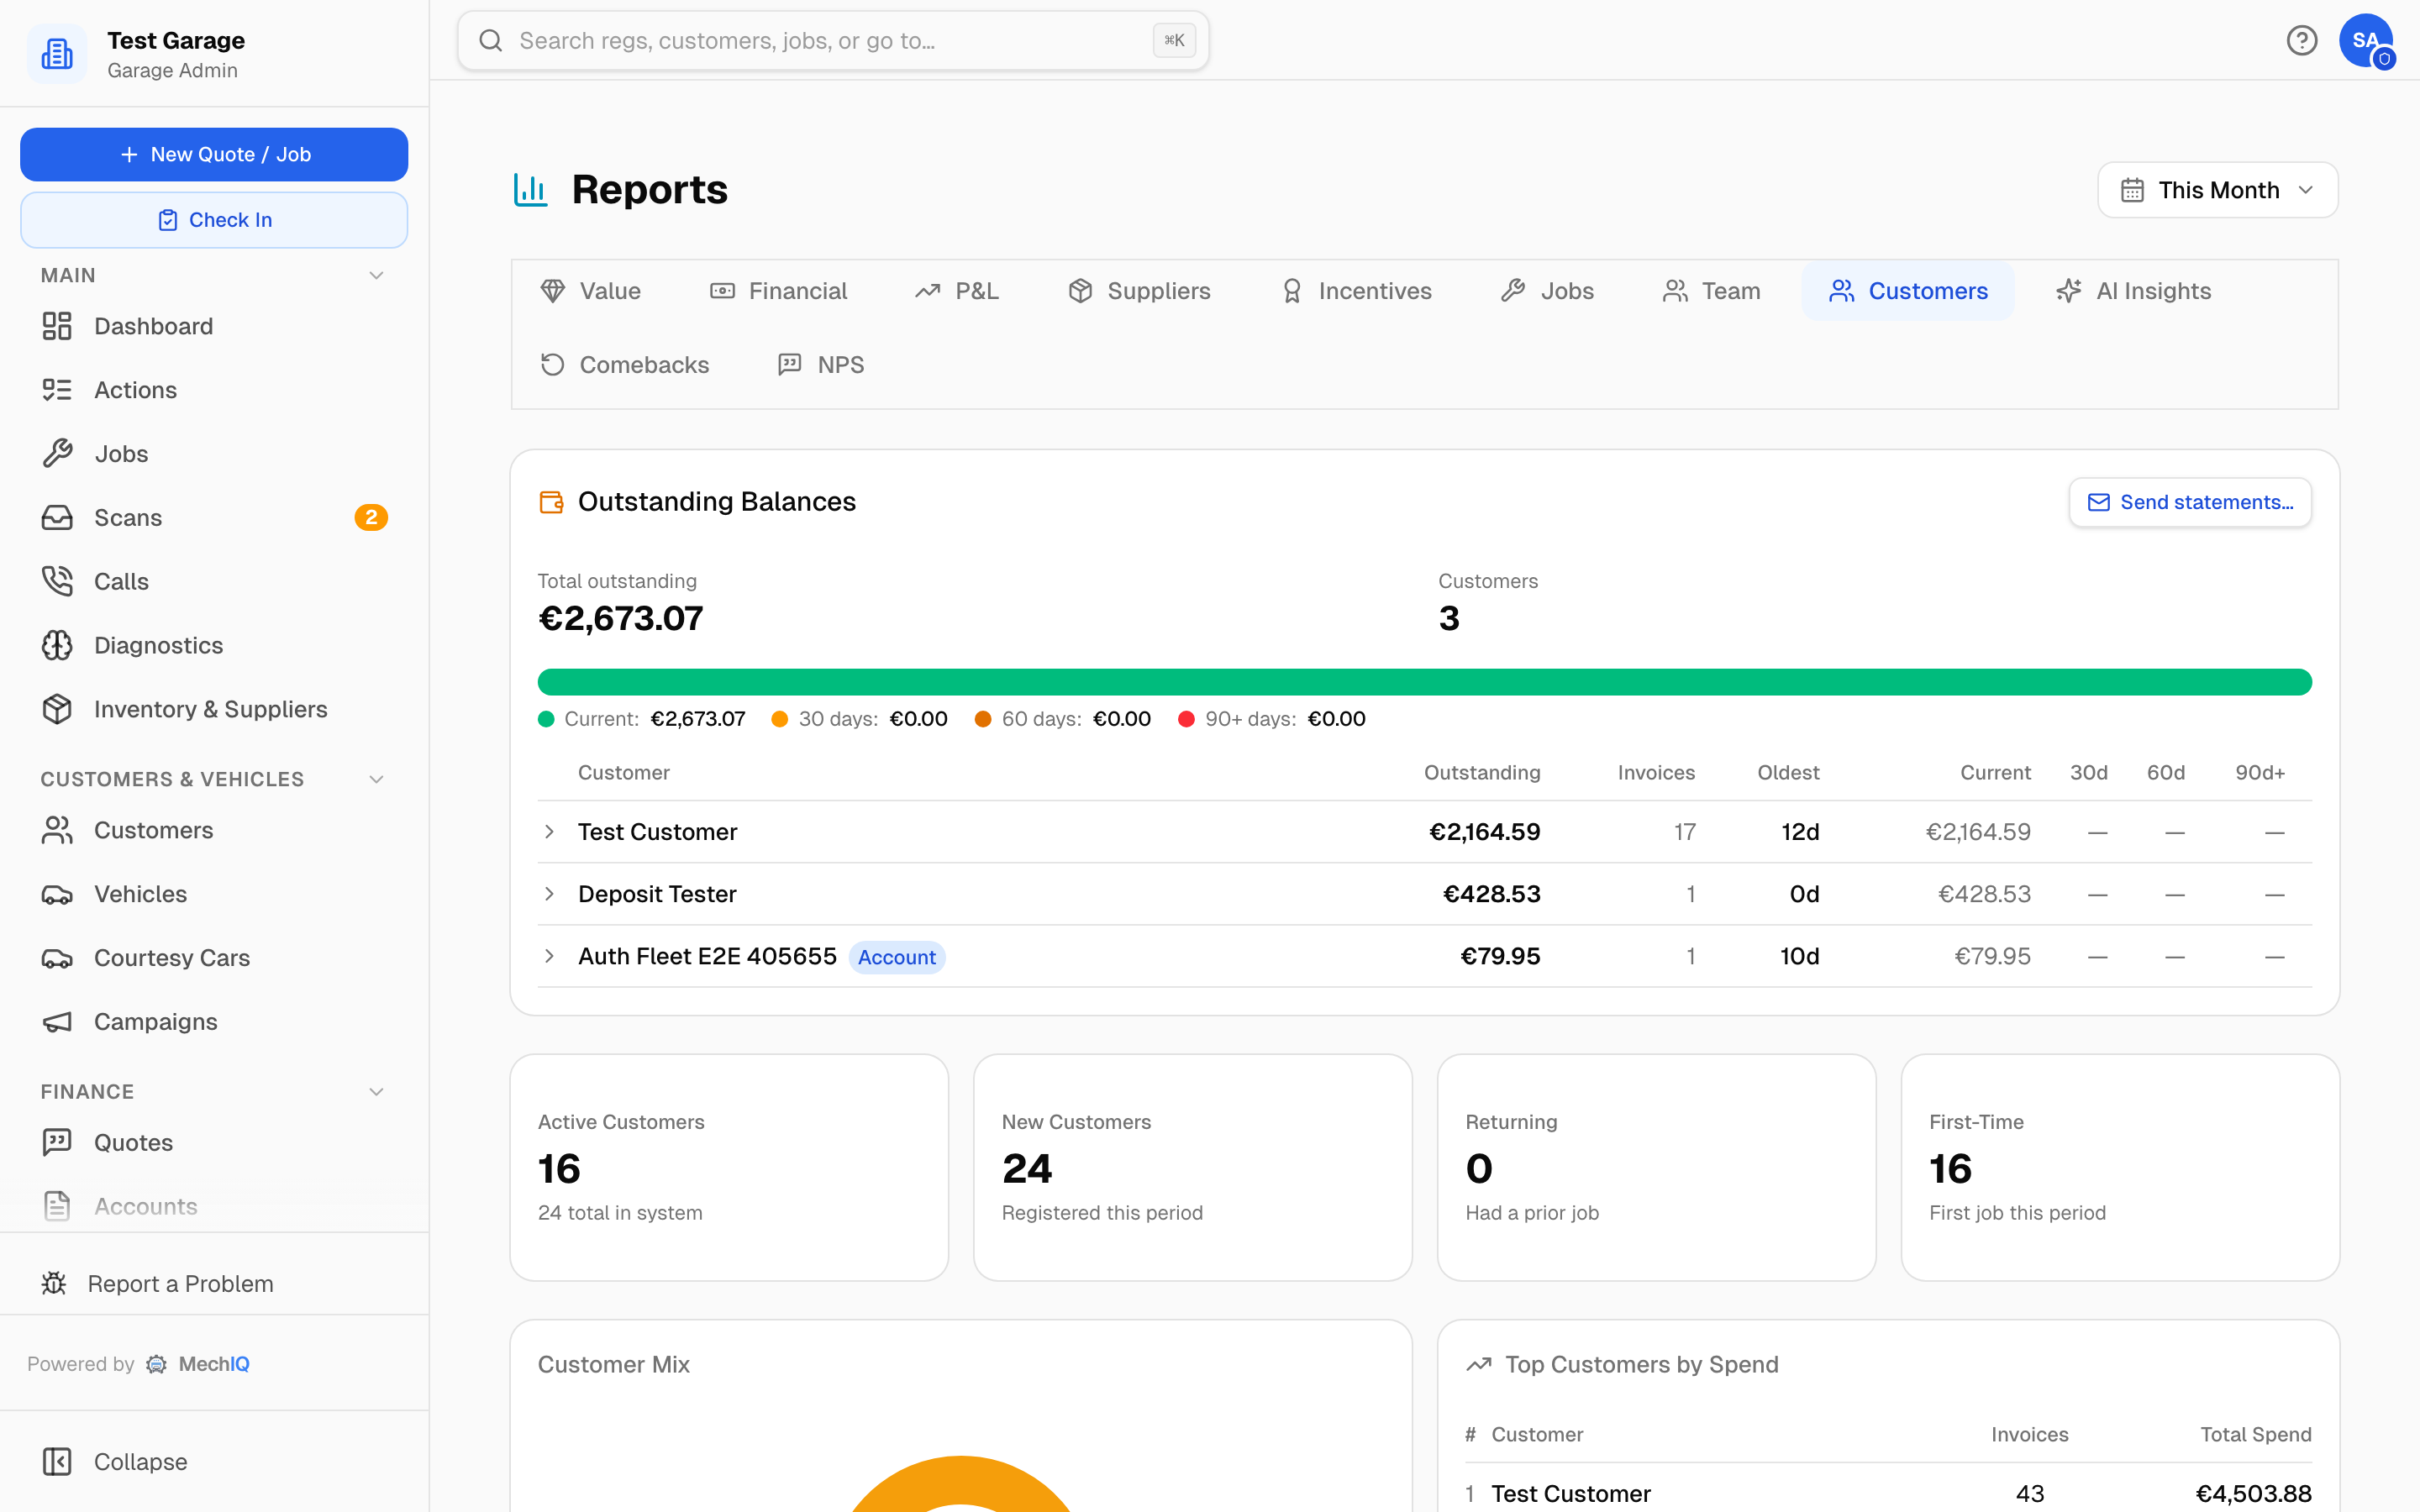 Reports → Customers.
AI Insights
AI Time Saved (estimated, split front desk / technicians, by action type -- the same estimate as the Value tab; quotes and diagnoses count more when the job was bigger) and how MechIQ's diagnoses performed — accuracy of estimates, success rate, the verdicts your technicians gave (confirmed, not found, deferred, modified, auto-resolved) and the most common components found.
Comebacks
Jobs that came back: total, comeback rate, waived value and safety issues; breakdowns by severity, technician (original job), job type and vehicle; and the recent comebacks with their reasons.
NPS
Customer satisfaction from the post-job rating link: the NPS score, average rating, response rate, promoters/passives/detractors, NPS by technician, recent responses with comments, and an AI summary of the comment themes. When a job is collected MechIQ drafts the survey message for the front desk to check and send -- a survey is never sent automatically.
Tips
- Review the Team tab regularly to spot training needs or workload imbalances.
- Booking sources (under Jobs) helps you decide where to invest in marketing.
- Watch Comebacks and NPS together — a rise in comebacks usually shows up in satisfaction scores too.